Contribution wealth path: same contributions, different asset terminals
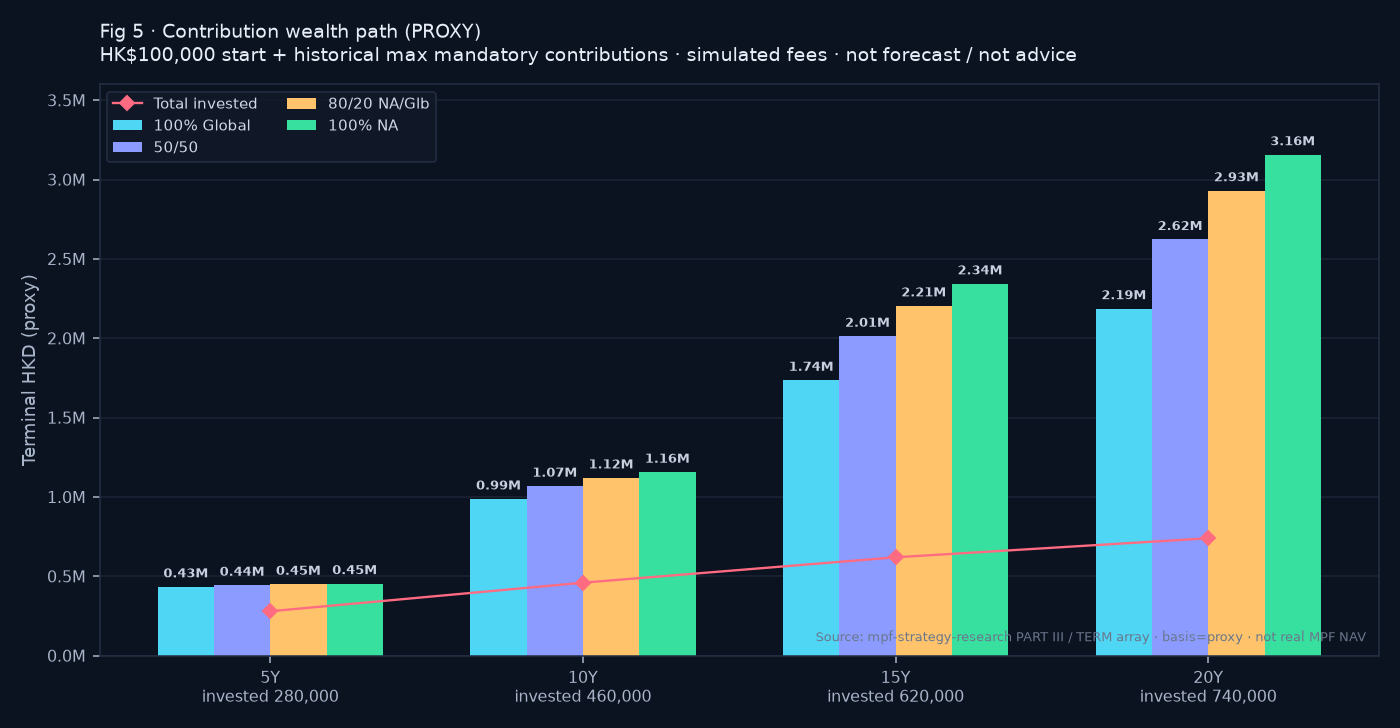
On a proxy path of HK$100,000 start + historical statutory max mandatory contributions (windows ending 2026-09), ~HK$740,000 was invested over 20 years: 100% North America equity proxy ends near HK$3,157,488, 100% global equity ~HK$2,187,421, bond proxy ~HK$844,661, conservative/cash ~HK$832,844; guaranteed funds have no long proxy → "—". Overseas index proxies with simulated fees — not real MPF NAV, not a forecast, not advice. On the same path grown only with HK Composite CPI (C&SD), the 20Y “keep up with inflation” terminal is about HK$945,895; vs that baseline, the NA equity proxy is about +233.81%, global +131.25%, bond −10.70%, conservative/cash −11.95%. The inflation path is a purchasing-power benchmark, not an investable fund, and not a forecast.
Last updated: 2026-10-29
Assumptions
• Initial HK$100,000; monthly historical statutory max mandatory contributions (employer+employee): HK$2,000 through May 2012; HK$2,500 Jun 2012–May 2014; HK$3,000 thereafter.
• Invested totals: 5Y HK$280,000 / 10Y HK$460,000 / 15Y HK$620,000 / 20Y HK$740,000. Windows all end 2026-09 (full sample 2006-10→2026-09; Fig 5 daily sample 5,030 points).
• Equity proxies deduct ~0.82% p.a. simulated MPF-like fee; bond extension uses VBMFX less 0.75% p.a. Underlying ETF/fund NAVs already embed their own fees.
• basis = proxy: not real MPF fund NAV, not a forecast, not advice.
Fig 5 vs sleeve table: keep sources separate
• Fig 5 / PROXY frontier 20Y 100% NA terminal HK$3,157,488; §03 sleeve table HK$3,156,532 (~HK$956 apart). Different study assumptions — do not average. Homepage Fig 5 uses the former.
• Fig 5 100% Global 20Y = HK$2,187,421 (CAGR ~7.40%) ≠ sleeve Global HK$2,316,745 (CAGR 7.61%).
• Bond is a US investment-grade aggregate proxy (VBMFX), not HK/Asia/RMB; guaranteed funds have no long proxy → "—".
proxy indexsimulated feeshistorical max mandatory contributionsnot a forecastnot adviceinflation baseline = Composite CPI / not an investable fund
Fig 5: equity-proxy terminals (all periods)
Fig 5 equity-mix terminals only; no bond/conservative. TW CAGR (no contrib): Global ~7.40%, NA ~10.18% (PROXY frontier).
| Period | Invested | 100% Global equity proxy | 50/50 North America / Global | 80/20 North America / Global | 100% North America equity proxy |
|---|---|---|---|---|---|
| 5Y | HK$280,000 | HK$434,582 | HK$444,702 | HK$450,796 | HK$454,865 |
| 10Y | HK$460,000 | HK$988,174 | HK$1,069,057 | HK$1,120,962 | HK$1,157,032 |
| 15Y | HK$620,000 | HK$1,736,410 | HK$2,013,984 | HK$2,205,113 | HK$2,343,981 |
| 20Y | HK$740,000 | HK$2,187,421 | HK$2,623,235 | HK$2,930,751 | HK$3,157,488 |
Bond / conservative / guaranteed extension
Recomputed on the same contribution path and windows. Bond = US aggregate proxy (VBMFX −0.75% p.a.), not HK bond. 20Y cash/conservative prefers sleeve-verified terminal 832,844 (computed 832,660, −0.022%). Guaranteed = no proxy.
| Period | Invested | 100% Bond proxy (US aggregate) | 100% Conservative / cash proxy | Guaranteed fund |
|---|---|---|---|---|
| 5Y | HK$280,000 | HK$274,743 | HK$302,258 | — |
| 10Y | HK$460,000 | HK$463,614 | HK$507,208 | — |
| 15Y | HK$620,000 | HK$649,060 | HK$688,925 | — |
| 20Y | HK$740,000 | HK$844,661 | HK$832,844 | — |
Bond 20Y month-end max drawdown about -19.17% (bonds can still see double-digit drawdowns). CSV: contribution_wealth_path.csv
Hong Kong inflation baseline (Composite CPI)
Same initial HK$100,000 and historical max mandatory contribution path; each month add contribution at month-start then compound by that month’s Composite CPI m/m change. Purchasing-power benchmark only — not an investable MPF fund.
Source: C&SD table 510-60001, series CC_CM_1920; as_of 2026-09. Formula: vs_inflation_pct = (asset_terminal ÷ inflation_terminal − 1) × 100 (positive = better than inflation path; negative = worse). Purchasing-power baseline / not an investable fund / not a forecast / not advice.
| Period | Invested | Inflation terminal | Ann. inflation |
|---|---|---|---|
| 5Y | HK$280,000 | HK$300,169 | 2.31% |
| 10Y | HK$460,000 | HK$511,792 | 1.77% |
| 15Y | HK$620,000 | HK$741,659 | 2.48% |
| 20Y | HK$740,000 | HK$945,895 | 2.50% |
Allocation terminals vs inflation path
Fig 5 equity terminals kept separate from bond/conservative extension; guaranteed = —. Inflation baseline row allocation_id = inflation_hk.
| Period | Allocation (proxy / baseline) | Terminal | vs inflation |
|---|---|---|---|
| 5Y | 100% Global equity proxy | HK$434,582 | +44.78% |
| 5Y | 50/50 North America / Global | HK$444,702 | +48.15% |
| 5Y | 80/20 North America / Global | HK$450,796 | +50.18% |
| 5Y | 100% North America equity proxy | HK$454,865 | +51.54% |
| 5Y | 100% Bond proxy (US aggregate) US aggregate VBMFX, not HK bond | HK$274,743 | -8.47% |
| 5Y | 100% Conservative / cash proxy | HK$302,258 | +0.70% |
| 5Y | Guaranteed fund No long comparable proxy | — | — |
| 5Y | HK Composite CPI (inflation baseline) / not an investable fund Purchasing-power baseline / not investable | HK$300,169 | 0.00% |
| 10Y | 100% Global equity proxy | HK$988,174 | +93.08% |
| 10Y | 50/50 North America / Global | HK$1,069,057 | +108.89% |
| 10Y | 80/20 North America / Global | HK$1,120,962 | +119.03% |
| 10Y | 100% North America equity proxy | HK$1,157,032 | +126.07% |
| 10Y | 100% Bond proxy (US aggregate) US aggregate VBMFX, not HK bond | HK$463,614 | -9.41% |
| 10Y | 100% Conservative / cash proxy | HK$507,208 | -0.90% |
| 10Y | Guaranteed fund No long comparable proxy | — | — |
| 10Y | HK Composite CPI (inflation baseline) / not an investable fund Purchasing-power baseline / not investable | HK$511,792 | 0.00% |
| 15Y | 100% Global equity proxy | HK$1,736,410 | +134.13% |
| 15Y | 50/50 North America / Global | HK$2,013,984 | +171.55% |
| 15Y | 80/20 North America / Global | HK$2,205,113 | +197.32% |
| 15Y | 100% North America equity proxy | HK$2,343,981 | +216.05% |
| 15Y | 100% Bond proxy (US aggregate) US aggregate VBMFX, not HK bond | HK$649,060 | -12.49% |
| 15Y | 100% Conservative / cash proxy | HK$688,925 | -7.11% |
| 15Y | Guaranteed fund No long comparable proxy | — | — |
| 15Y | HK Composite CPI (inflation baseline) / not an investable fund Purchasing-power baseline / not investable | HK$741,659 | 0.00% |
| 20Y | 100% Global equity proxy | HK$2,187,421 | +131.25% |
| 20Y | 50/50 North America / Global | HK$2,623,235 | +177.33% |
| 20Y | 80/20 North America / Global | HK$2,930,751 | +209.84% |
| 20Y | 100% North America equity proxy | HK$3,157,488 | +233.81% |
| 20Y | 100% Bond proxy (US aggregate) US aggregate VBMFX, not HK bond | HK$844,661 | -10.70% |
| 20Y | 100% Conservative / cash proxy | HK$832,844 | -11.95% |
| 20Y | Guaranteed fund No long comparable proxy | — | — |
| 20Y | HK Composite CPI (inflation baseline) / not an investable fund Purchasing-power baseline / not investable | HK$945,895 | 0.00% |
20Y sleeve table (§03 / Finding 1) — separate source
Kept separate from Fig 5 — do not average. Cash mixes and conservative terminals use this table; pure NA/Global equity terminals on the homepage and Fig 5 table use Fig 5 TERM.
| Allocation | CAGR | MDD | Terminal | ROI |
|---|---|---|---|---|
| 100% North America equity proxy | 10.16% | ~−51% to −56% | HK$3,156,532 | +326.6% |
| 100% Global equity proxy | 7.61% | −55.47% daily / −51.72% monthly | HK$2,316,745 | +213.1% |
| 70% Global equity + 30% cash | 6.30% | −37.55% monthly | HK$1,899,127 | +156.6% |
| 60% Global equity + 40% cash | 5.79% | −32.53% monthly | HK$1,757,650 | +137.5% |
| 100% Conservative / cash proxy | 0.91% | near 0% | HK$832,844 | +12.5% |
Fig 5 / PROXY frontier (daily VFINX/ACWI, 0.82% fee, monthly rebalance) 20Y 100% NA terminal = 3,157,488; §03 / Finding 1 sleeve table (R1 cash/equity contribution study) = 3,156,532. Separately, Fig 5 100% Global 20Y = 2,187,421 (CAGR 7.40%) vs sleeve Global 2,316,745 (CAGR 7.61%) — different study assumptions; do not average. This pack keeps both sources distinct.
Methodology · Market-timing study · Fee impact calculator · eMPF switching
FAQ
How far apart are equity vs conservative proxies on the same contribution path?
Over the 20Y window (2006-10→2026-09) with ~HK$740,000 invested, Fig 5’s 100% North America equity proxy ends near HK$3,157,488 versus ~HK$832,844 for the conservative/cash proxy (sleeve-table verified). Overseas market proxies with simulated fees — historical only, not real fund NAV, not a forecast or advice.
How did the bond proxy do?
On the same path, the US aggregate bond proxy (VBMFX −0.75% p.a.) ends near HK$844,661 over 20Y (TW CAGR ~2.05%); the 5Y window can finish below total invested. This is a US investment-grade aggregate proxy, not HK/Asia/RMB bonds.
Are these real MPF fund returns?
No. Equities use overseas proxies (e.g. VFINX/ACWI) with ~0.82% p.a. simulated fees; bonds use VBMFX −0.75% p.a.; cash/conservative uses the study cash series. Guaranteed funds have no long comparable proxy → "—".
How are contributions modelled?
Start HK$100,000; monthly historical statutory max mandatory (employer+employee): HK$2,000 through May 2012, HK$2,500 Jun 2012–May 2014, HK$3,000 thereafter. Invested totals ≈ HK$280k / 460k / 620k / 740k for 5/10/15/20Y. Not any individual’s actual contributions.
Why are there two close North America 20Y terminals?
Fig 5 / daily PROXY frontier = HK$3,157,488; §03 sleeve table = HK$3,156,532 (~HK$956 apart). Different study assumptions — we label both and do not average. Homepage Fig 5 uses the former.
Do you recommend a fund type?
No. This page shows historical proxy backtests and assumptions only — not investment, switching, or allocation advice. Verify with the trustee, MPFA and eMPF, and consider independent professional advice.
How do the proxies compare with Hong Kong inflation?
Under the same contribution assumptions, growing the account only with the HK Composite CPI (C&SD) yields about HK$945,895 over 20 years. Versus that “keep up with inflation” baseline: Fig 5 NA equity proxy is about +233.81%, global +131.25%; bond proxy about −10.70%, conservative/cash about −11.95%. Purchasing-power benchmark only — not an investable fund return, not a forecast or advice.