MPF Historical Returns by Asset Class: 1, 5 and 10 Years, Plus Long-Term Data Since 2002
Over the long run, which asset class returned more?
Per MPFA data as of 2026-09-30, the median 10 years annualised return was 6.97% for equity funds (n=143), 1.35% for conservative / money market and −0.06% for bond funds; over 5 years equity was 5.67%. Dispersion within equity is wide: over 10 years a quarter of equity funds returned 3.06% a year or less. DIS launched only in 2017, so fewer than 5 funds have a 10 years record and it is not compared. Past performance is not indicative of future results.
Long-term returns by asset class: median and 25th–75th percentile
Pick a period to compare every fund in each asset class with a record for that period. The bar is the median (from 0%) and the whisker is the middle half of funds (25th–75th percentile); a wider whisker means a bigger gap between funds in the same class.
Data as of 2026-09-30MPFA-published fund returns, grouped by MPFA fund category; each period has its own 0% baseline
Source: 1-, 5- and 10-year returns published on the MPFA MPF Fund Platform (as of 2026-09-30). DIS = Core Accumulation Fund and Age 65 Plus Fund; mixed assets exclude DIS funds. n = funds with a return for the period; classes with fewer than 5 funds are muted and not compared. Longer periods include fewer funds (n falls), and only current funds are counted (closed or merged funds drop out), so there is survivorship bias. 1-year figures are cumulative; 5- and 10-year figures are annualised. Past performance is not indicative of future results.
Proxy indices, not MPF funds
Long-term reference (2002–2026): market proxy indices, not MPF funds
The MPFA publishes fund returns only for 1, 5 and 10 years, and there are no fund prices before July 2020, so longer periods can only be referenced with market proxy indices. Proxy figures cannot be compared directly with the fund medians above.
End value of HK$10,000, 2001-12 to 2026-09, ranked: Equity HK$57,382 > Default Investment Strategy (DIS) HK$40,157 > Bond HK$17,937 > Conservative / money market HK$12,812
Growth of HK$10,000: market proxy indices (2001-12 to 2026-09)
EquityproxyHK$57,382
Default Investment Strategy (DIS)proxyHK$40,157
Conservative / money marketproxyHK$12,812
BondproxyHK$17,937
Mixed assets (ex-DIS)No proxy
GuaranteedNo proxy
Proxy index paths, not the actual return of any MPF fund or class; net of simulated fees; one-off investment, no further contributions. Historical illustration only, not a projection. Index names are in the notes below.
Notes
Equity: Global equity proxy: ACWI from 2008-04; 0.6 VFINX + 0.4 VGTSX from 2002 to Mar 2008; less 1.0% p.a. fee
Default Investment Strategy (DIS): DIS Core proxy: 60% global equity proxy + 40% VBMFX, total fee 0.75% p.a. (no A65F proxy; DIS launched 2017-04)
Conservative / money market: Cash proxy: US 3m T-bill -0.8% p.a. before 2012; 1m HIBOR -0.8% 2012..2020-07; real MPF Conservative Fund average 2020-08 on
Bond: Bond proxy: VBMFX (Vanguard Total Bond Market Index, USD, US investment-grade) less 0.75% p.a.; not HK/Asia/RMB bonds
Mixed assets (ex-DIS): no proxy (none was defined for this class in the studies)
Guaranteed: no proxy (none was defined for this class in the studies)
Proxy indices are shown after estimated fees; the gap versus MPF funds comes mainly from regional allocation (MPF equity funds hold many Hong Kong and China stocks). The bond proxy is US bonds.
Proxy index annualised returns (proxy indices, not fund medians; not comparable with the fund figures above)
Proxy index annualised returns (proxy indices, not fund medians; not comparable with the fund figures above)
Class
15 years2011-10 – 2026-09
20 years2006-10 – 2026-09
Since 20022002-01 – 2026-09
Equity
10.91%
7.20%
7.31%
Default Investment Strategy (DIS)
7.16%
5.58%
5.78%
Mixed assets (ex-DIS)
No proxy
No proxy
No proxy
Conservative / money market
0.85%
0.91%
1.01%
Guaranteed
No proxy
No proxy
No proxy
Bond
0.87%
2.05%
2.39%
Proxy data are USD-denominated overseas funds and indices (HKD peg assumed), for historical reference only; not a forecast or recommendation. Methodology
Growth of HK$10,000: equal-weight research composites of real MPF funds (2020-07 to 2026-09)
EquityHK$15,562
Default Investment Strategy (DIS)HK$13,161
Mixed assets (ex-DIS)HK$13,048
Conservative / money marketHK$11,143
GuaranteedHK$10,035
BondHK$9,411
Site-calculated research composites: each month, the simple (equal-weight) average unit-price return of current funds in the class. Not any single fund and not investable; current funds only (survivor bias); net of fund fees; one-off investment, no further contributions. Historical illustration only, not a projection. Only about 6 years of real prices exist, and fewer funds contribute in early months (lower n).
Read these figures with care
From April 2022 to August 2024 the equity composite was below the conservative composite in most months. Over the whole period, the equity composite’s month-end maximum drawdown was −37.34%.
A quarter of equity funds had a 10 years annualised return of 3.06% or less, and a 5-year return of 1.06% or less.
The longer the period, the fewer funds with a full record (equity n=167 over 1 year, n=143 over 10 years); only current funds are counted, so closed or merged funds drop out (survivorship bias).
The median 5-year returns of the Hong Kong equity (−1.38%) and China equity (−3.16%) categories were negative.
This site’s real MPF price history starts in July 2020 (2020–2026), a short window; longer periods can only be referenced with the market proxy indices above, which are not MPF fund returns.
Month-end prices understate intra-month falls in sharp shocks.
Historical backtest results from this site’s research. They are not forecasts, and no strategy is implied to repeat them.
01 · LESS TIMING 2015–2026 out of sample
147 / 160
Out of sample (Jan 2015 to Sep 2026), 147 of 160 timing-rule variants had a lower annualised return than continuously holding 100% equity (8.99% a year on the v2 mix, 9.85% on the global mix).
Rules: 28 timing rules (equity 70–100%), checked monthly (28 variants), bi-weekly (26) or daily (26) — 80 per equity mix, on 2 mixes, 160 in total; the benchmark is continuously holding 100% equity. Rules were designed on data from Oct 2002 to Dec 2014. Data: US-listed proxy funds less a 1% a year fee, not actual MPF returns.
The same timing rules checked daily (about 5.9 switches a year) returned a median 7.97% a year, against 8.59% when checked monthly (about 1.4 switches a year).
Period: Jan 2015 to Sep 2026 (out of sample), v2 equity mix; the global mix gave 8.89% daily vs 9.35% monthly. All 52 daily-check variants across both mixes returned less than holding equity. Proxy-data backtest.
From July 2020 to September 2026, HK$10,000 in this site’s own equal-weight composite of MPF equity funds grew to about HK$15,560, the highest of the 6 asset-class composites. The composite is a simple average of all current equity funds computed by this site, not any single fund.
In the Oct 2002 to Sep 2026 proxy backtest, continuous 100% equity returned 9.19% a year against 7.02% for the DIS Core Accumulation benchmark. Note: an average result with survivor bias; a quarter of equity funds returned 1.06% a year or less over 5 years.
Backtest limits: about 1,050 strategy and parameter evaluations with no multiple-testing adjustment; out-of-sample periods were not fully blind; proxies are US-listed USD funds less a 1% a year fee.
Finding: asset choice matters far more than market timing
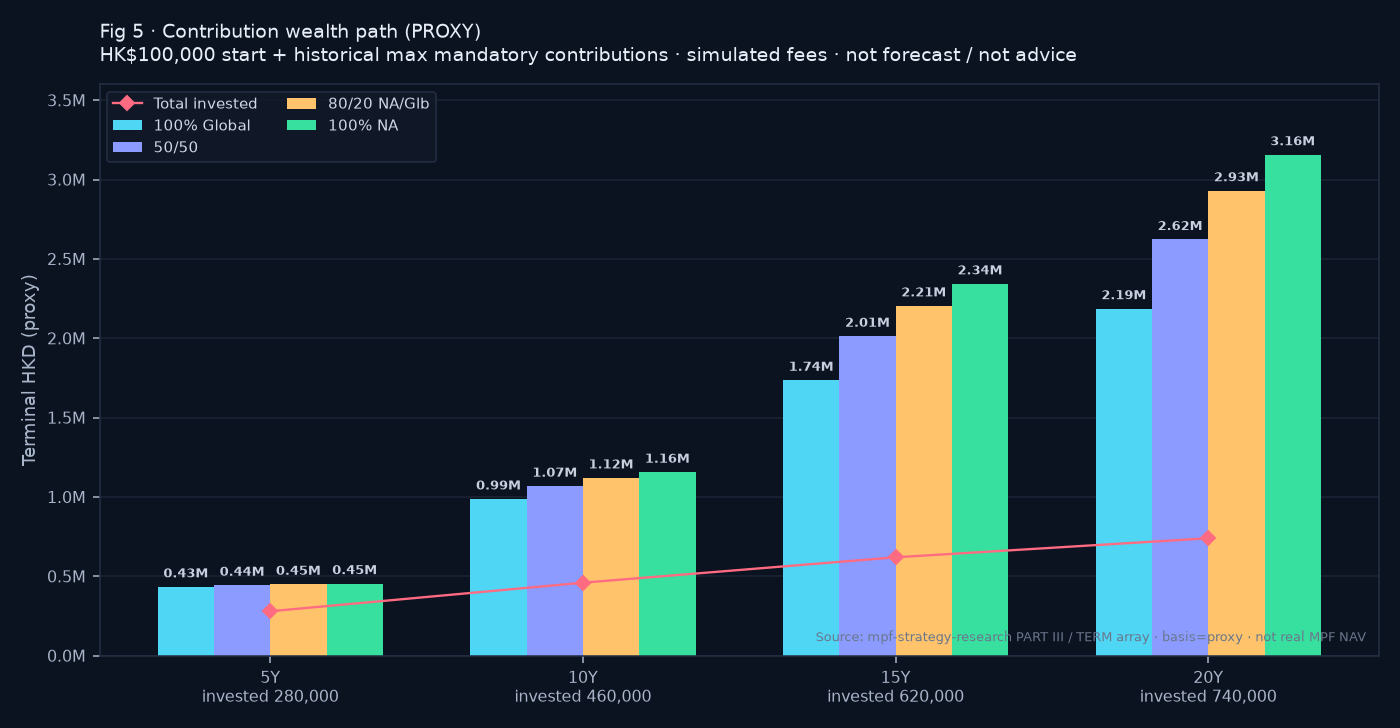
Same contribution path (HK$100,000 start + historical max mandatory contributions), proxy backtest to 2026-09: 20Y 100% North America equity proxy ends near HK$3,157,488 vs conservative/cash proxy HK$832,844 (HK$740,000 invested).
proxy indexsimulated feeshistorical max mandatory contributionsnot a forecastnot adviceinflation baseline = Composite CPI / not an investable fundAs of 2026-09
Fig 5 (compact): proxy allocation terminals on the same contribution path
Chart: Fig 5 equity-proxy terminals (5/10/15/20Y). Full table and bond/conservative extension on the research page.
Vs inflation: same contribution path grown only with HK Composite CPI ends near HK$945,895 over 20Y; NA equity proxy ~+234% above that path, global ~+131%, bond ~−11%, conservative/cash ~−12% (purchasing-power benchmark, not an investable fund).
Phase 1 Full Portability is targeted for 21 Dec 2026 for eligible employees (pending LegCo). Compare schemes with public fee and performance data (not a transfer referral).
Data as of 2026-09-30Median of all 425 eligible funds: +2.40%.
Note: Ranks 1–2 and 3–4 are share classes of the same funds; ranks 8–9 are funds with the same name and return in two schemes; the ranking reflects one historical figure and is not a recommendation.
Filter: ≥60 months of prices and a 5-year return (n=425). Sorted by MPFA 5-year annualised return.
Hang Seng Mandatory Provident Fund - SuperTrust Plus
US equity
+11.65%
+17.33%
1.32%
75
-23.67%
10
BOC-Prudential Japan Equity Fund
BOC-Prudential Easy-Choice Mandatory Provident Fund Scheme
Japan equity
+11.62%
+28.12%
1.64%
75
-22.43%
* Published by the MPFA (data as of 2026-09-30). † Calculated by this site from month-end unit prices, 2020-07 to 2026-09; "Months" = number of month-end prices available — figures from short histories are less reliable. n/a = not available. Click a column header to sort.
How have MPF funds performed over the past 5 years?
Per MPFA data as of 2026-09-30, the median 5-year annualised return across 425 funds with a 5-year record was +2.40%; the highest was +21.24% (Haitong Korea Fund - Class A). Past performance is not indicative of future results.
Which MPF asset class had the highest median 5-year return?
As of 2026-09-30, the median 5-year annualised return was 5.67% for equity funds (n=153), 4.36% for DIS, 2.82% for mixed assets (ex-DIS), 2.05% for conservative / money market, −0.34% for guaranteed and −1.39% for bond funds. Dispersion within equity is wide: a quarter of equity funds returned 1.06% a year or less. Past performance is not indicative of future results.
Did switching funds more often lead to higher returns?
Not in this site’s backtest. 2015–2026 out-of-sample backtest: the same timing rules checked daily (about 5.9 switches a year) returned a median 7.97% a year, against 8.59% when checked monthly (about 1.4 switches a year). Backtests are historical simulations, not advice.
Is this ranking a fund recommendation?
No. It sorts funds by a single historical figure, ignores risk and personal circumstances, and is not a suggestion to buy, hold or switch any fund.
Where does the data come from?
Returns, fees and fund size come from the MPFA MPF Fund Platform (as of 2026-09-30); volatility and max drawdown are calculated by this site from month-end prices 2020-07 – 2026-09.
What is the median fund expense ratio?
Across 446 funds with a published FER, the median is 1.23%.
Important: Historical data for general information only — not investment advice or a recommendation of any fund, and it does not consider anyone's objectives or circumstances. Past performance is not indicative of future results; prices can go down as well as up. MPFA-published returns and fees are as of 2026-09-30; site-calculated metrics (annualised return, volatility, max drawdown) use month-end prices 2020-07 – 2026-09 and may contain errors or delays. Before any decision, read the trustee's offering documents and MPFA information, and consult a licensed or registered professional where appropriate. The asset-class composites on this page include current funds only (survivor bias); backtests use proxy data and many parameter tests, so results may overstate achievable returns, and they are not a recommendation of any strategy. Full disclaimer · Methodology